Architecture visuals are centralized here so technical pages stay focused and the same material is not repeated across the website.
These diagrams explain the platform from roadside sensors to regional operations and national clearing.
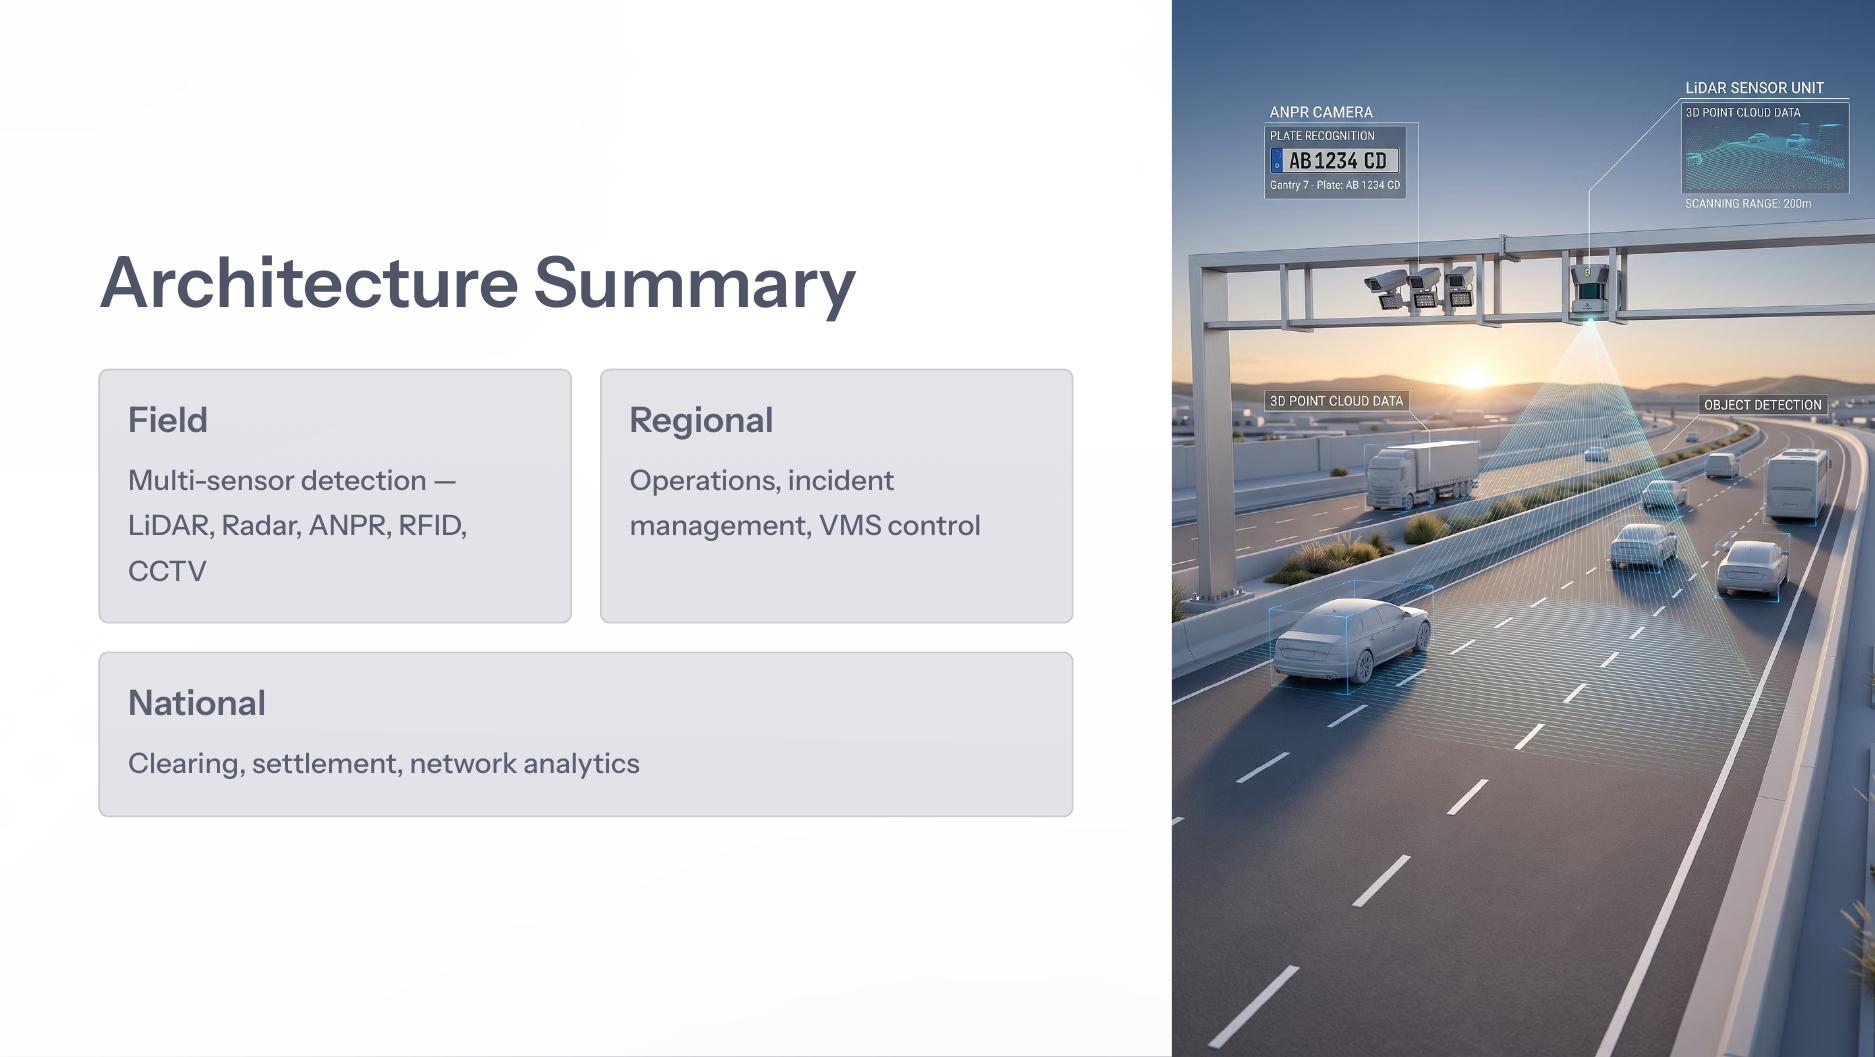
Field, regional and national layers with LiDAR, ANPR and tolling evidence.
Open page →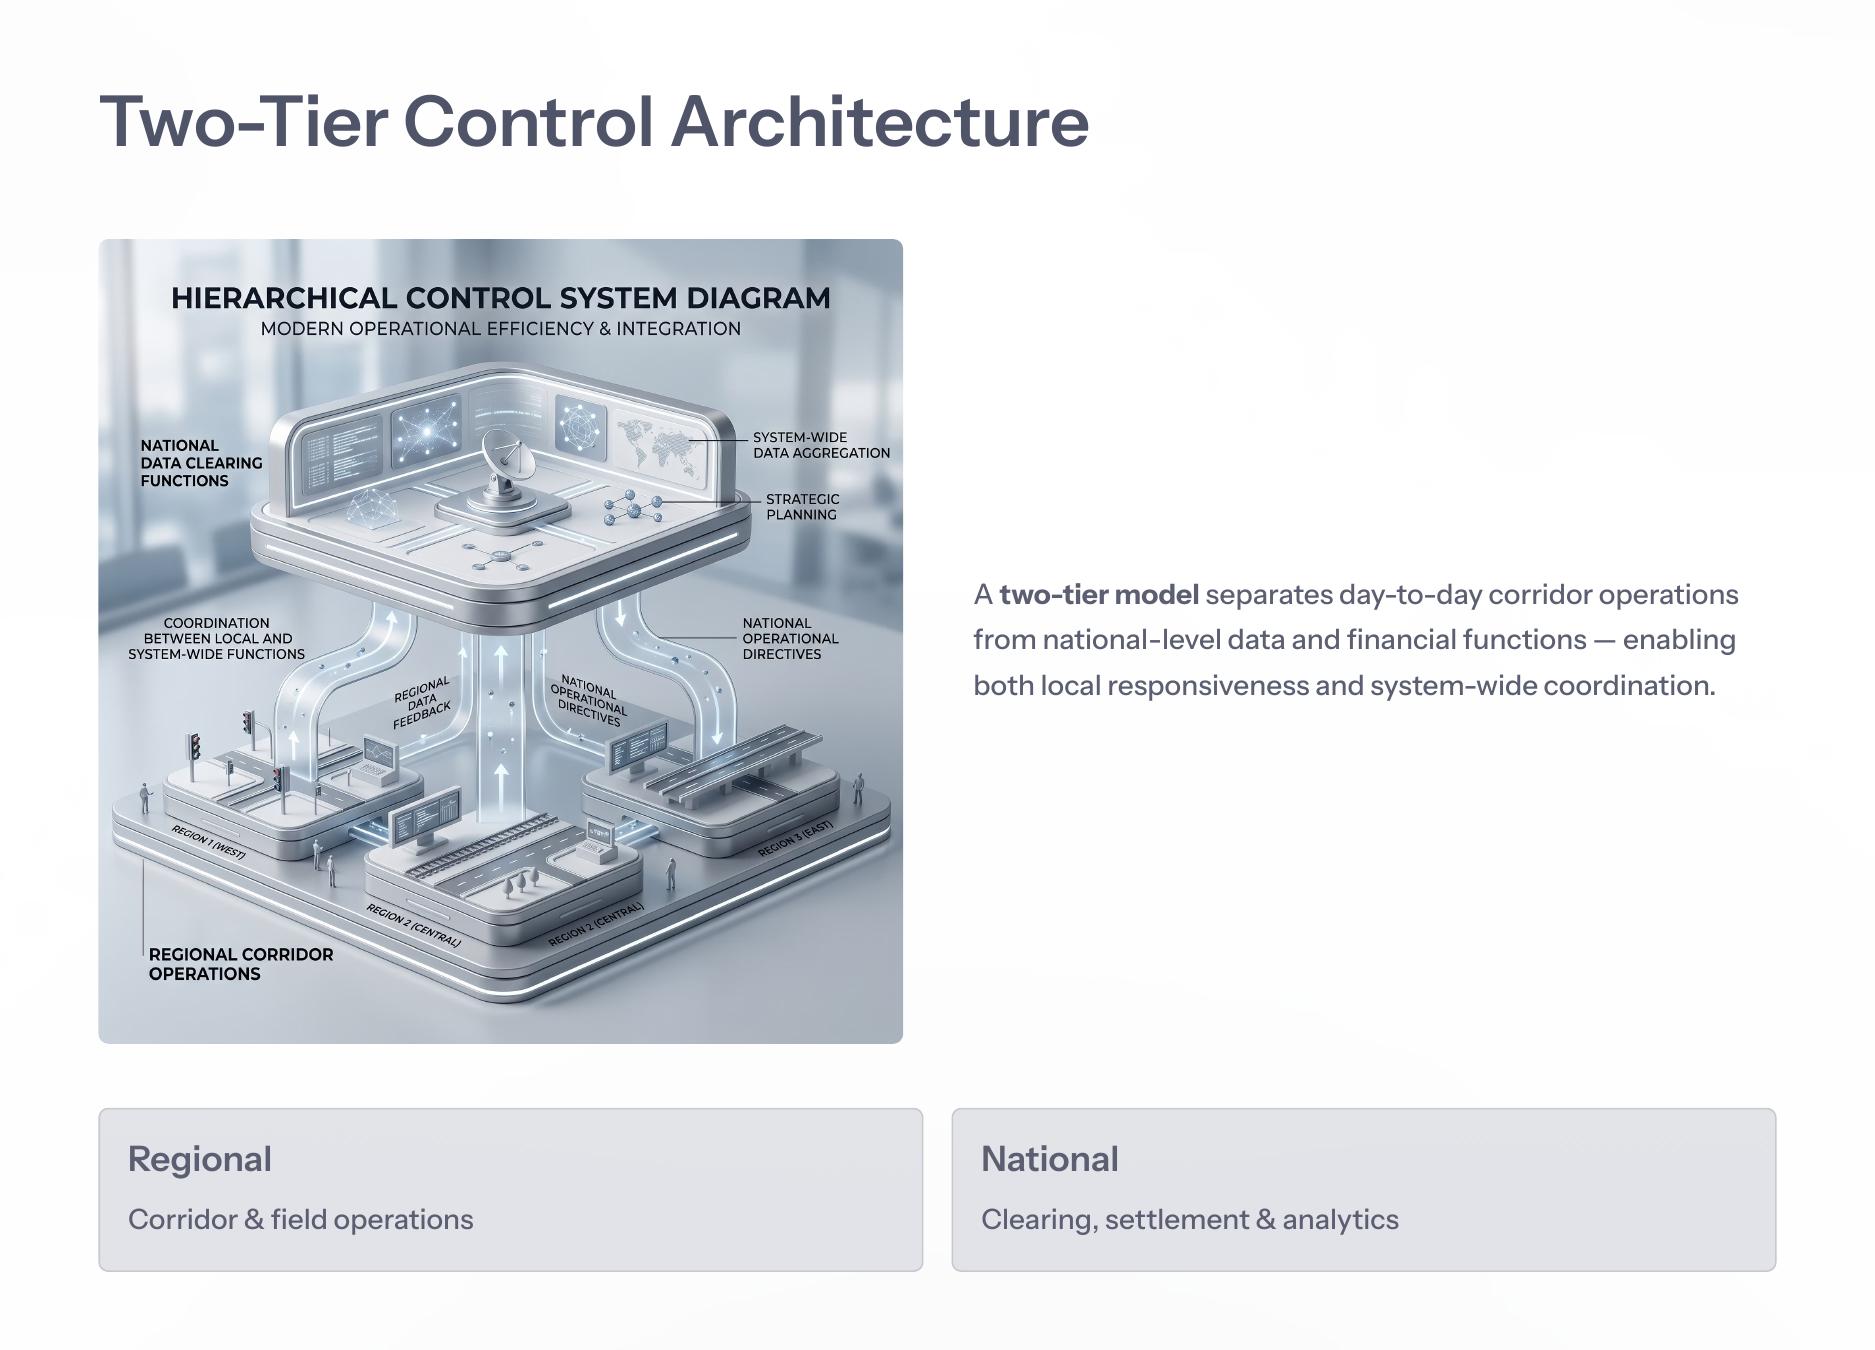
Regional operations separated from national clearing, settlement and analytics.
Open page →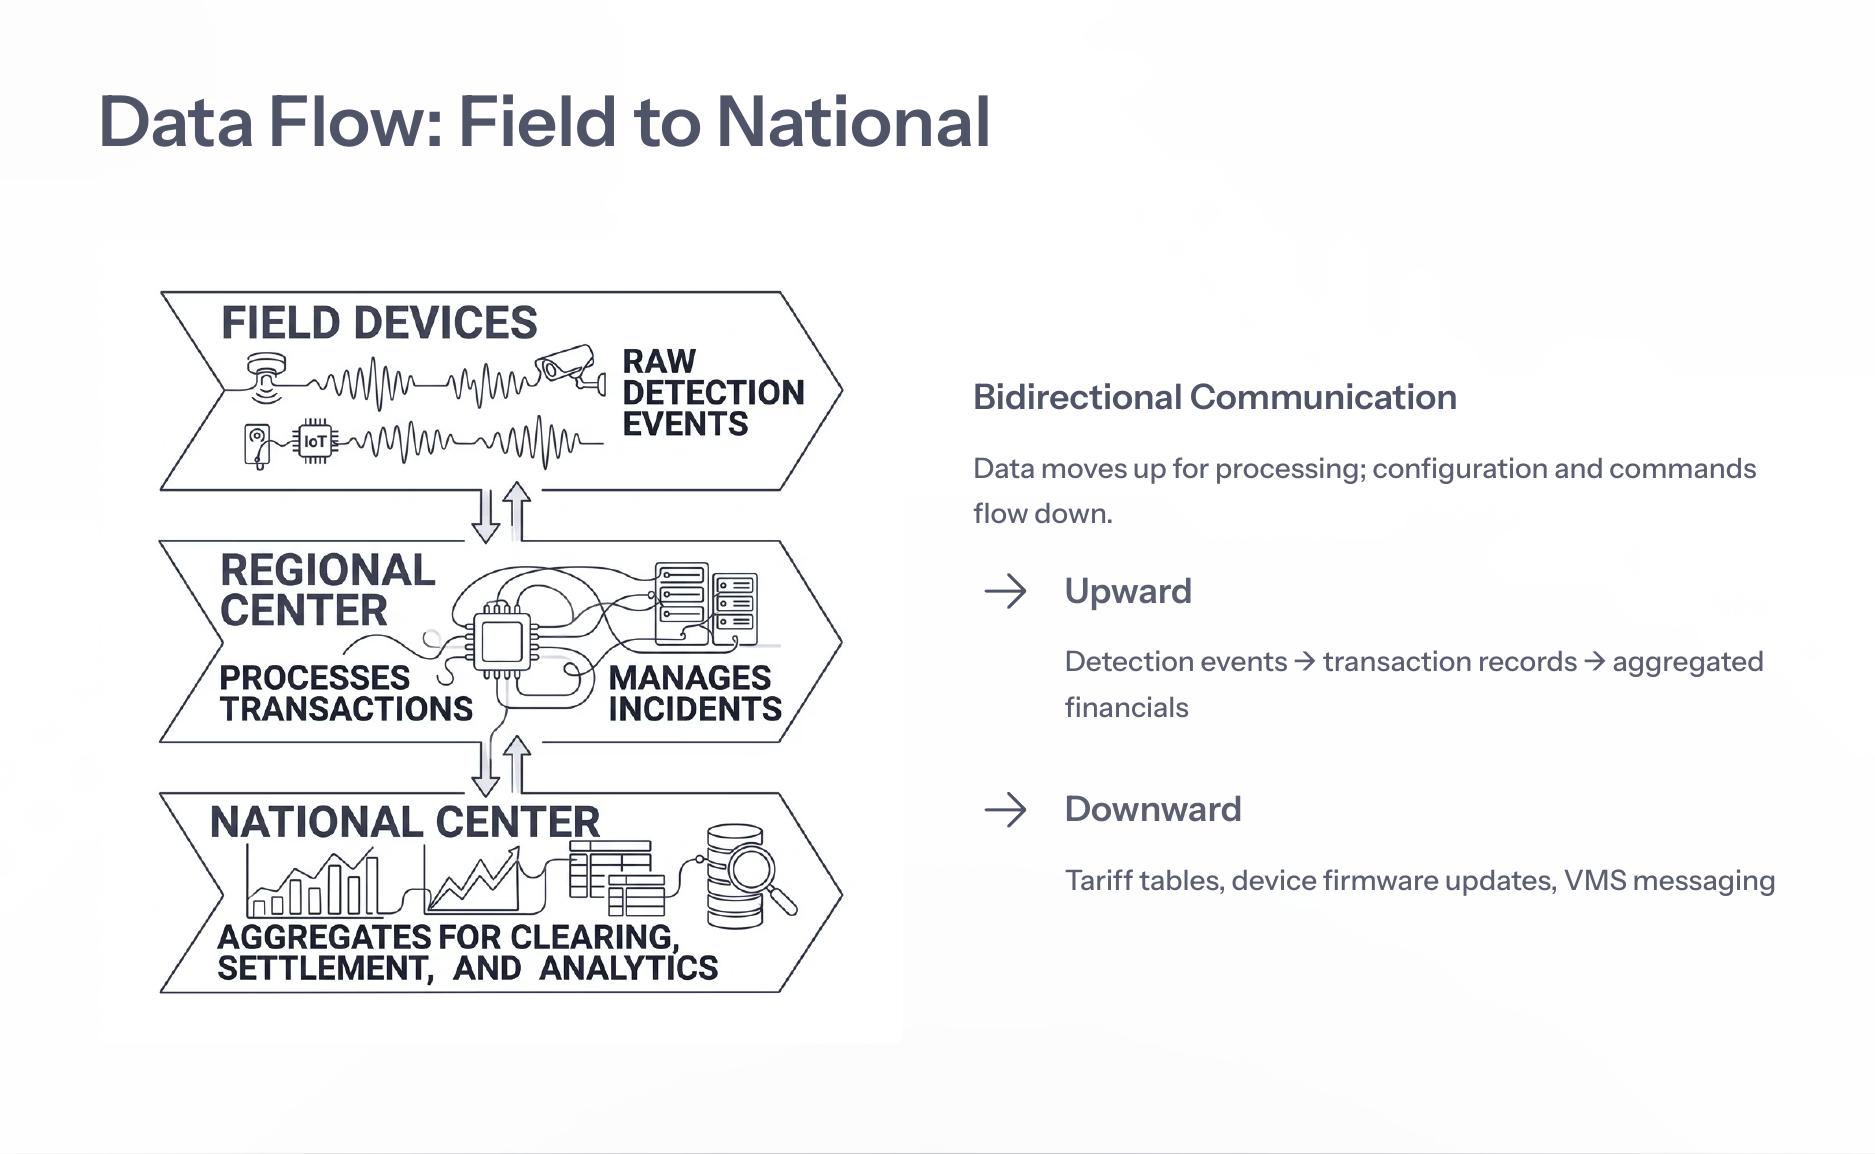
Bidirectional communication: data up, commands down.
Open page →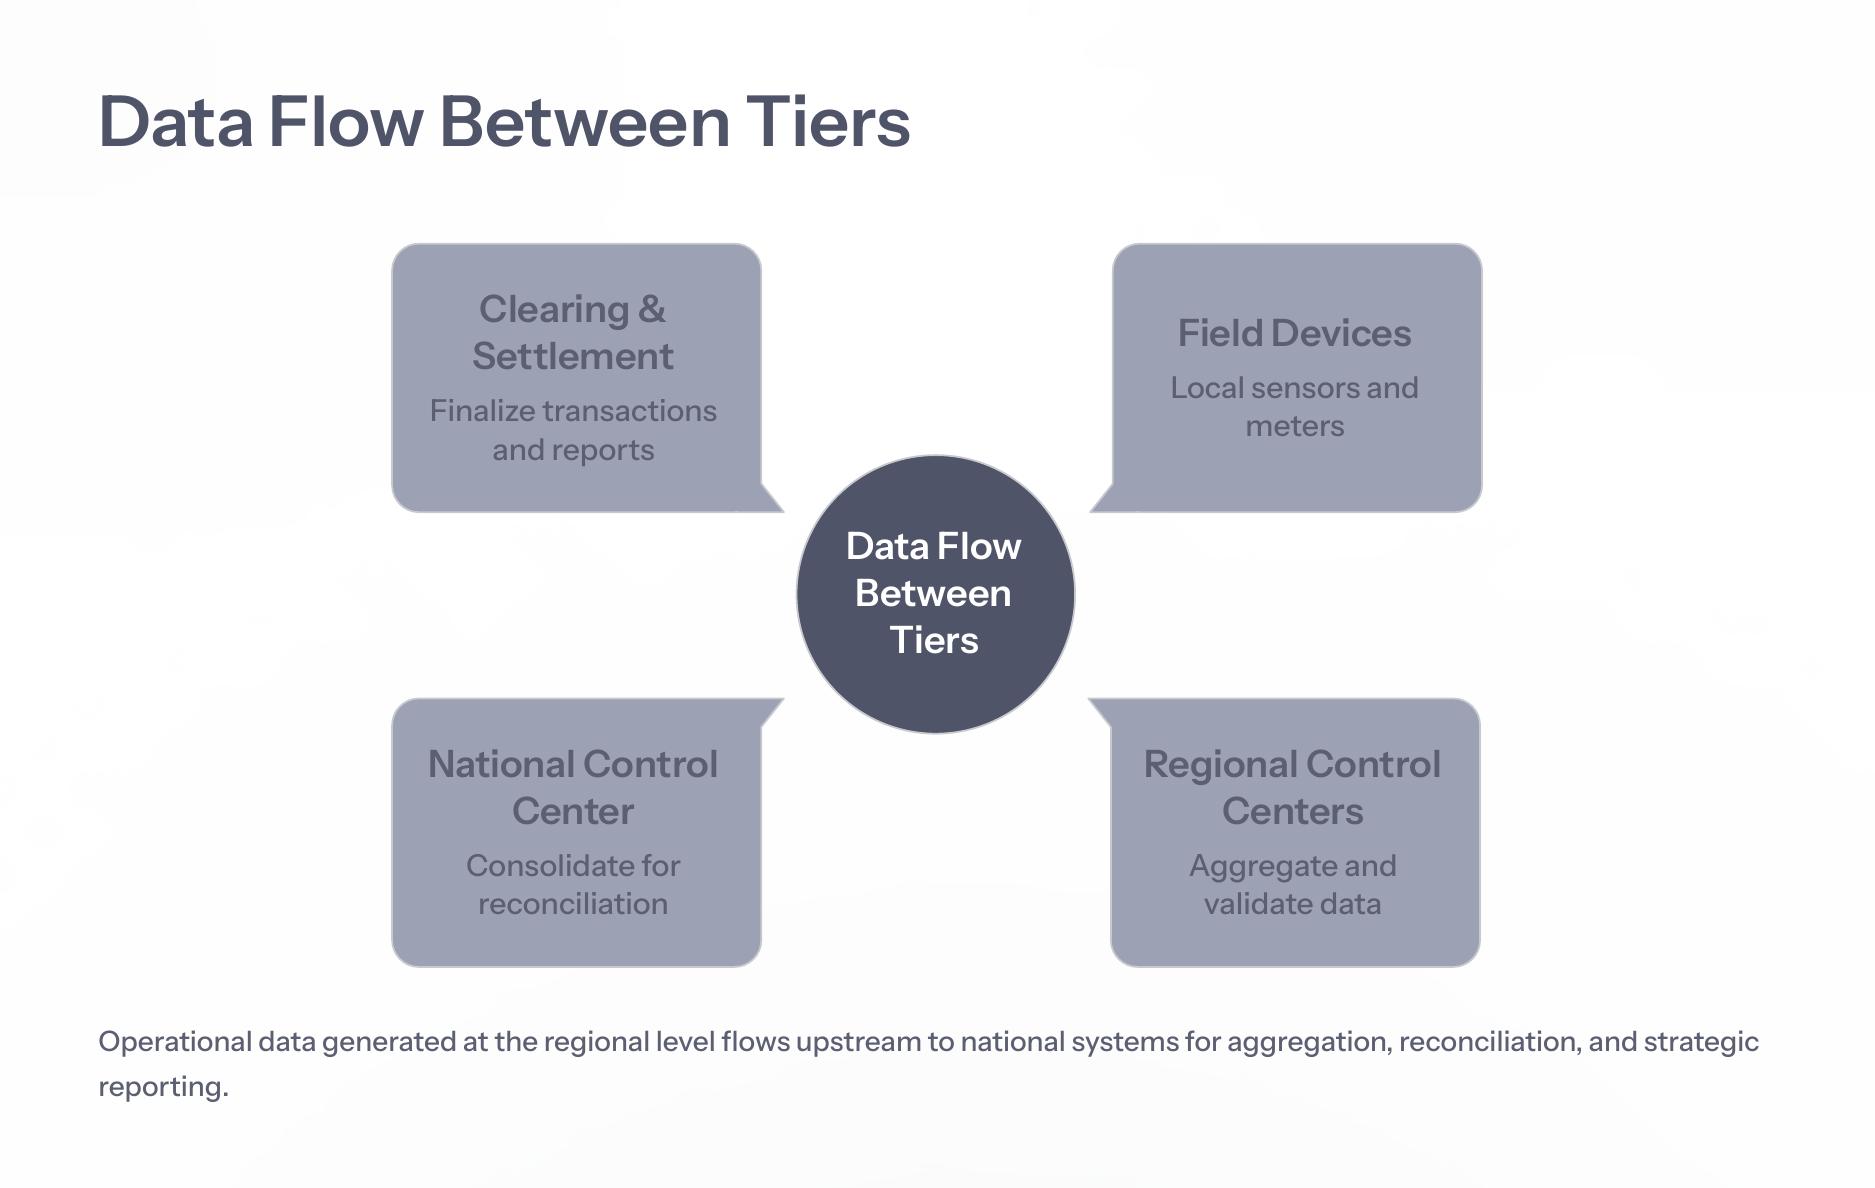
Regional validation to national reconciliation and reporting.
Open page →These visuals support technical discussions with highway operators, EPCs, integrators and system auditors.
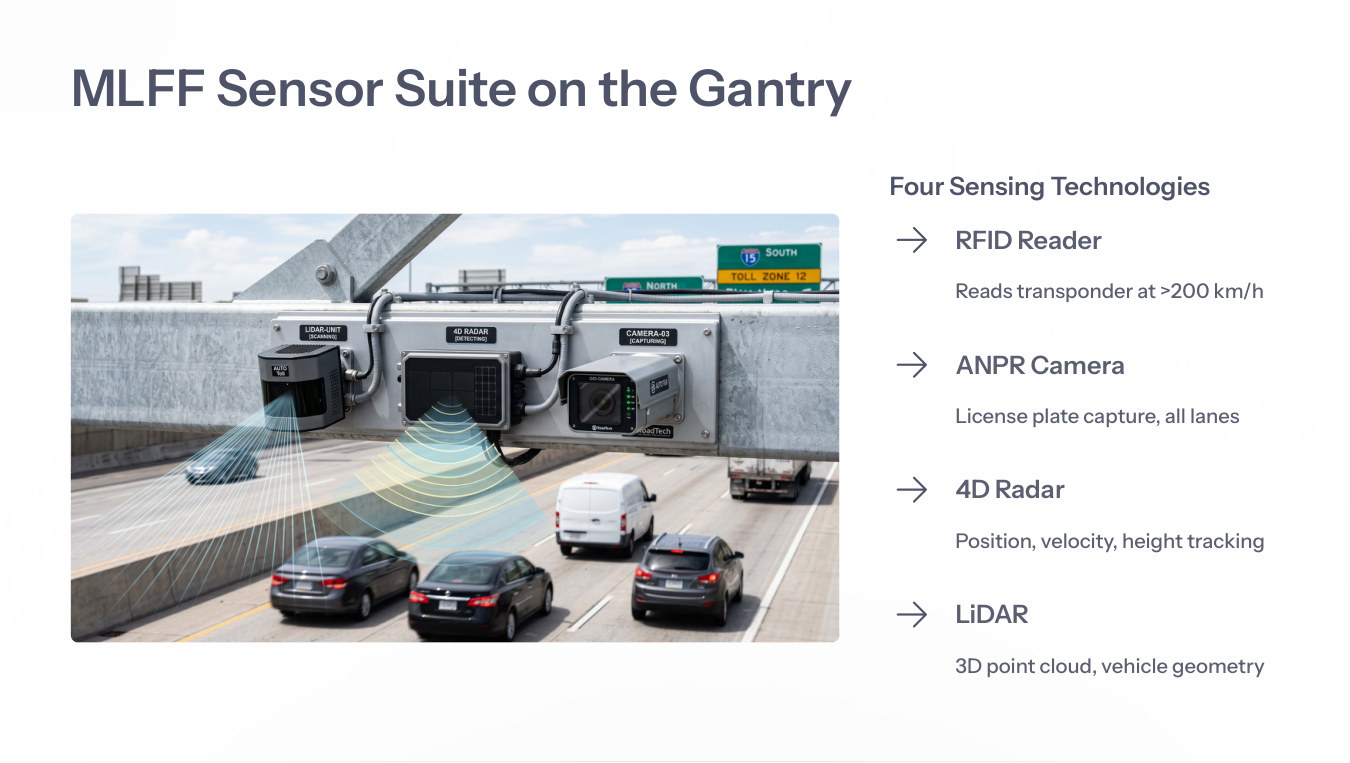
RFID, ANPR, 4D radar and LiDAR on the gantry.
Open page →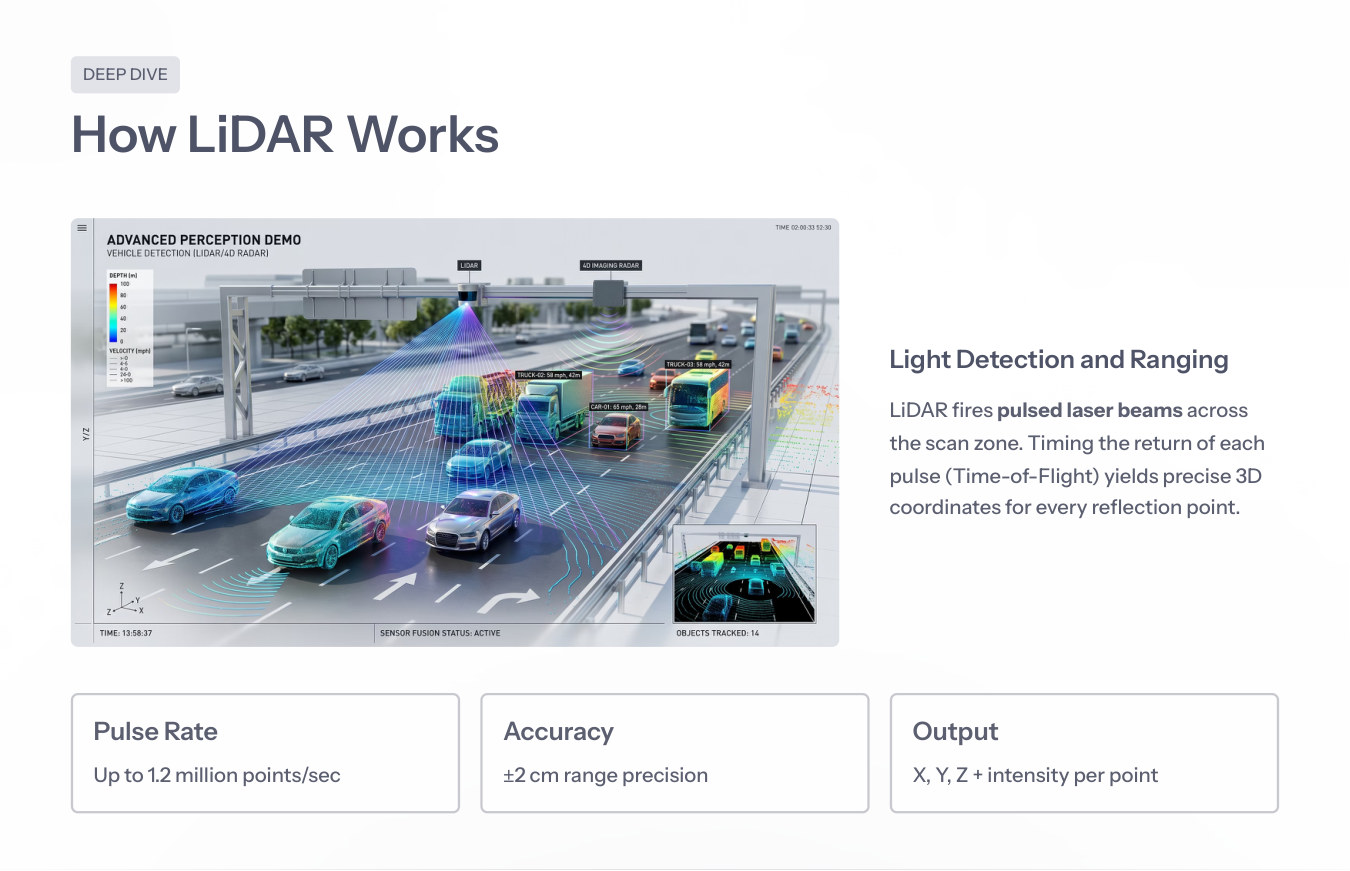
Time-of-flight scanning and X, Y, Z plus intensity outputs.
Open page →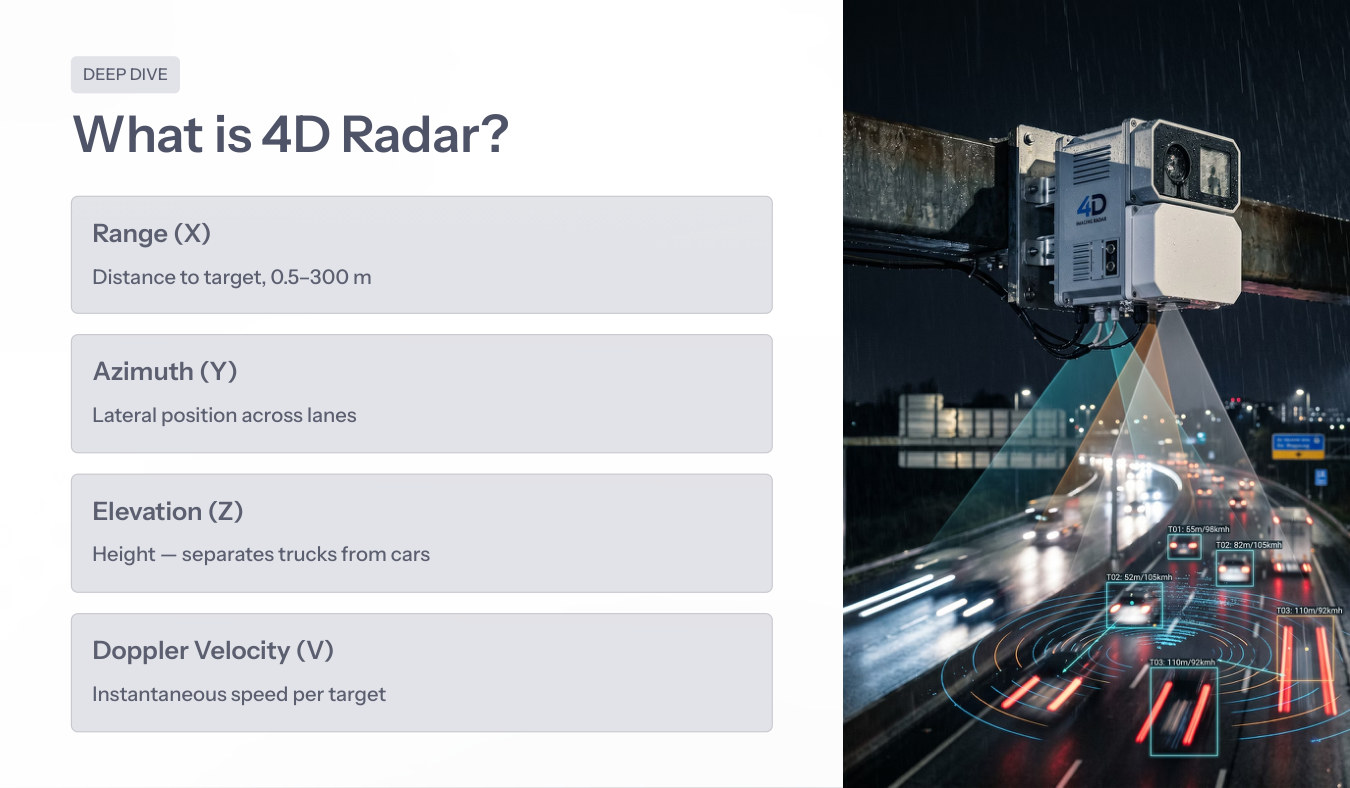
Range, azimuth, elevation and Doppler velocity for persistent tracking.
Open page →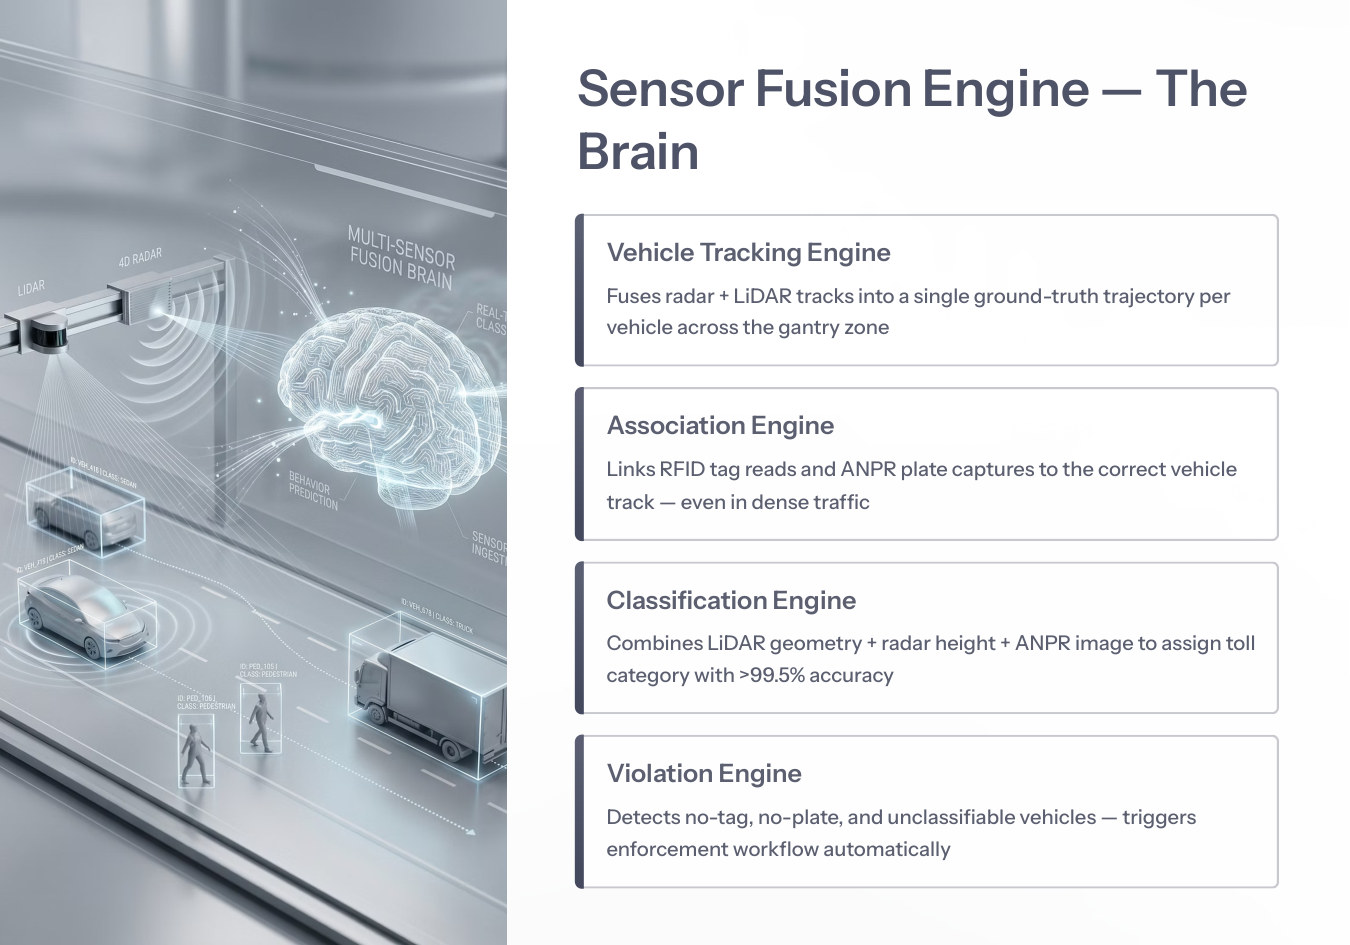
Vehicle tracking, association, classification and violation engines.
Open page →Use-case visuals are kept in the library and linked to their canonical pages.
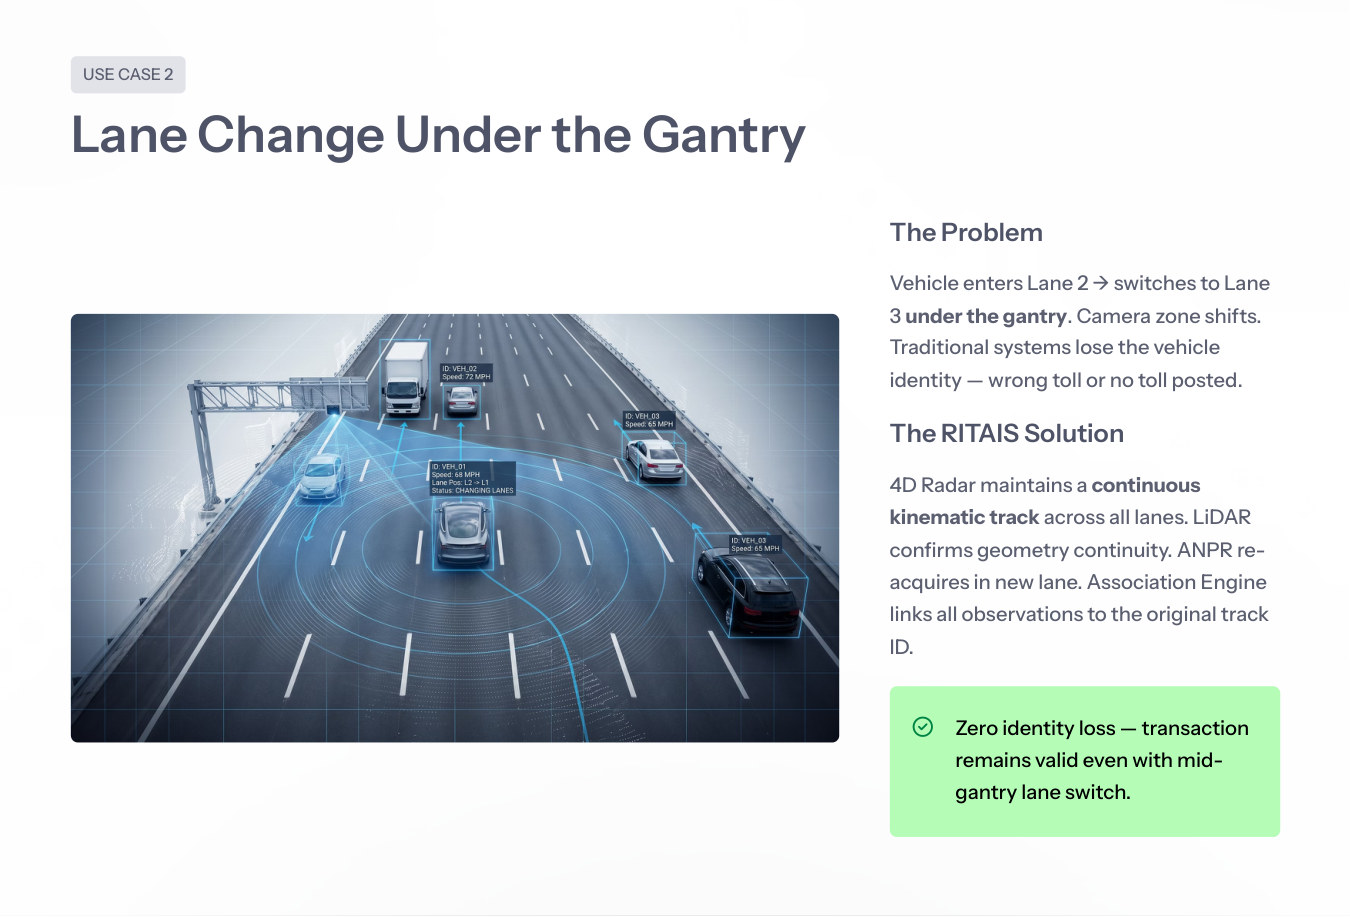
Continuous identity during lane switching under the gantry.
Open page →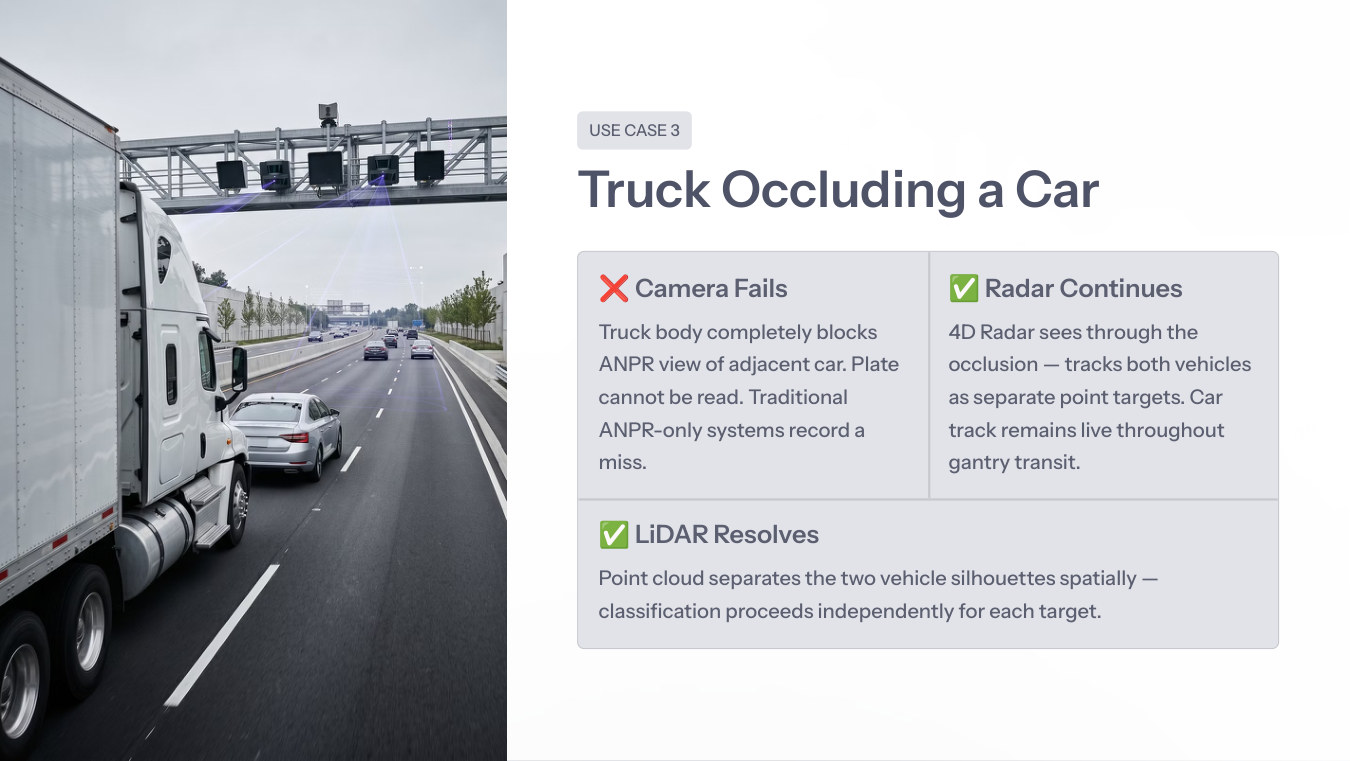
Radar and LiDAR continuity when ANPR line-of-sight fails.
Open page →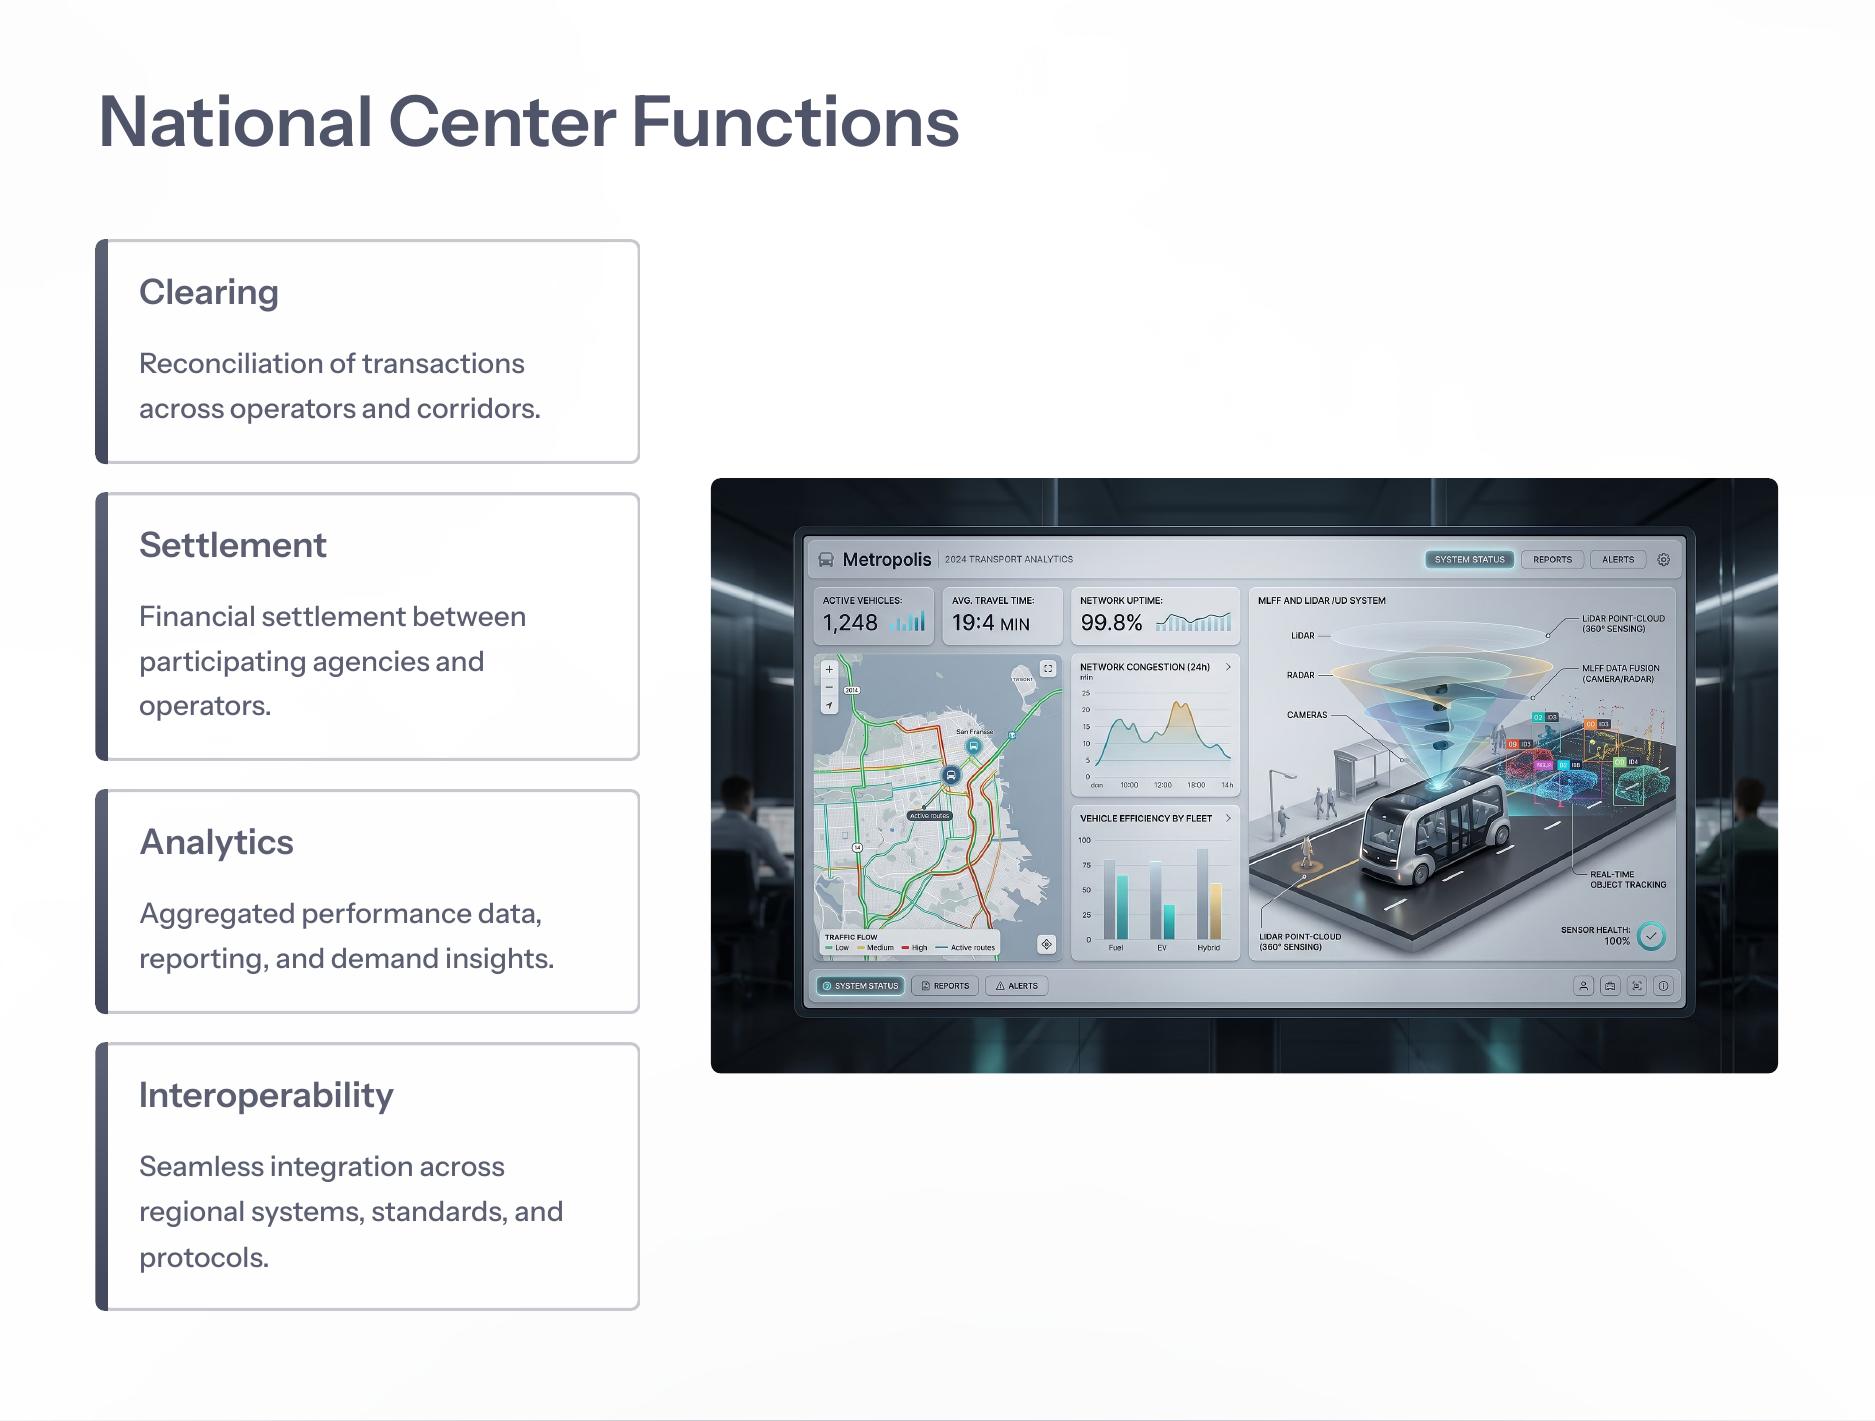
Clearing, settlement, analytics and interoperability.
Open page →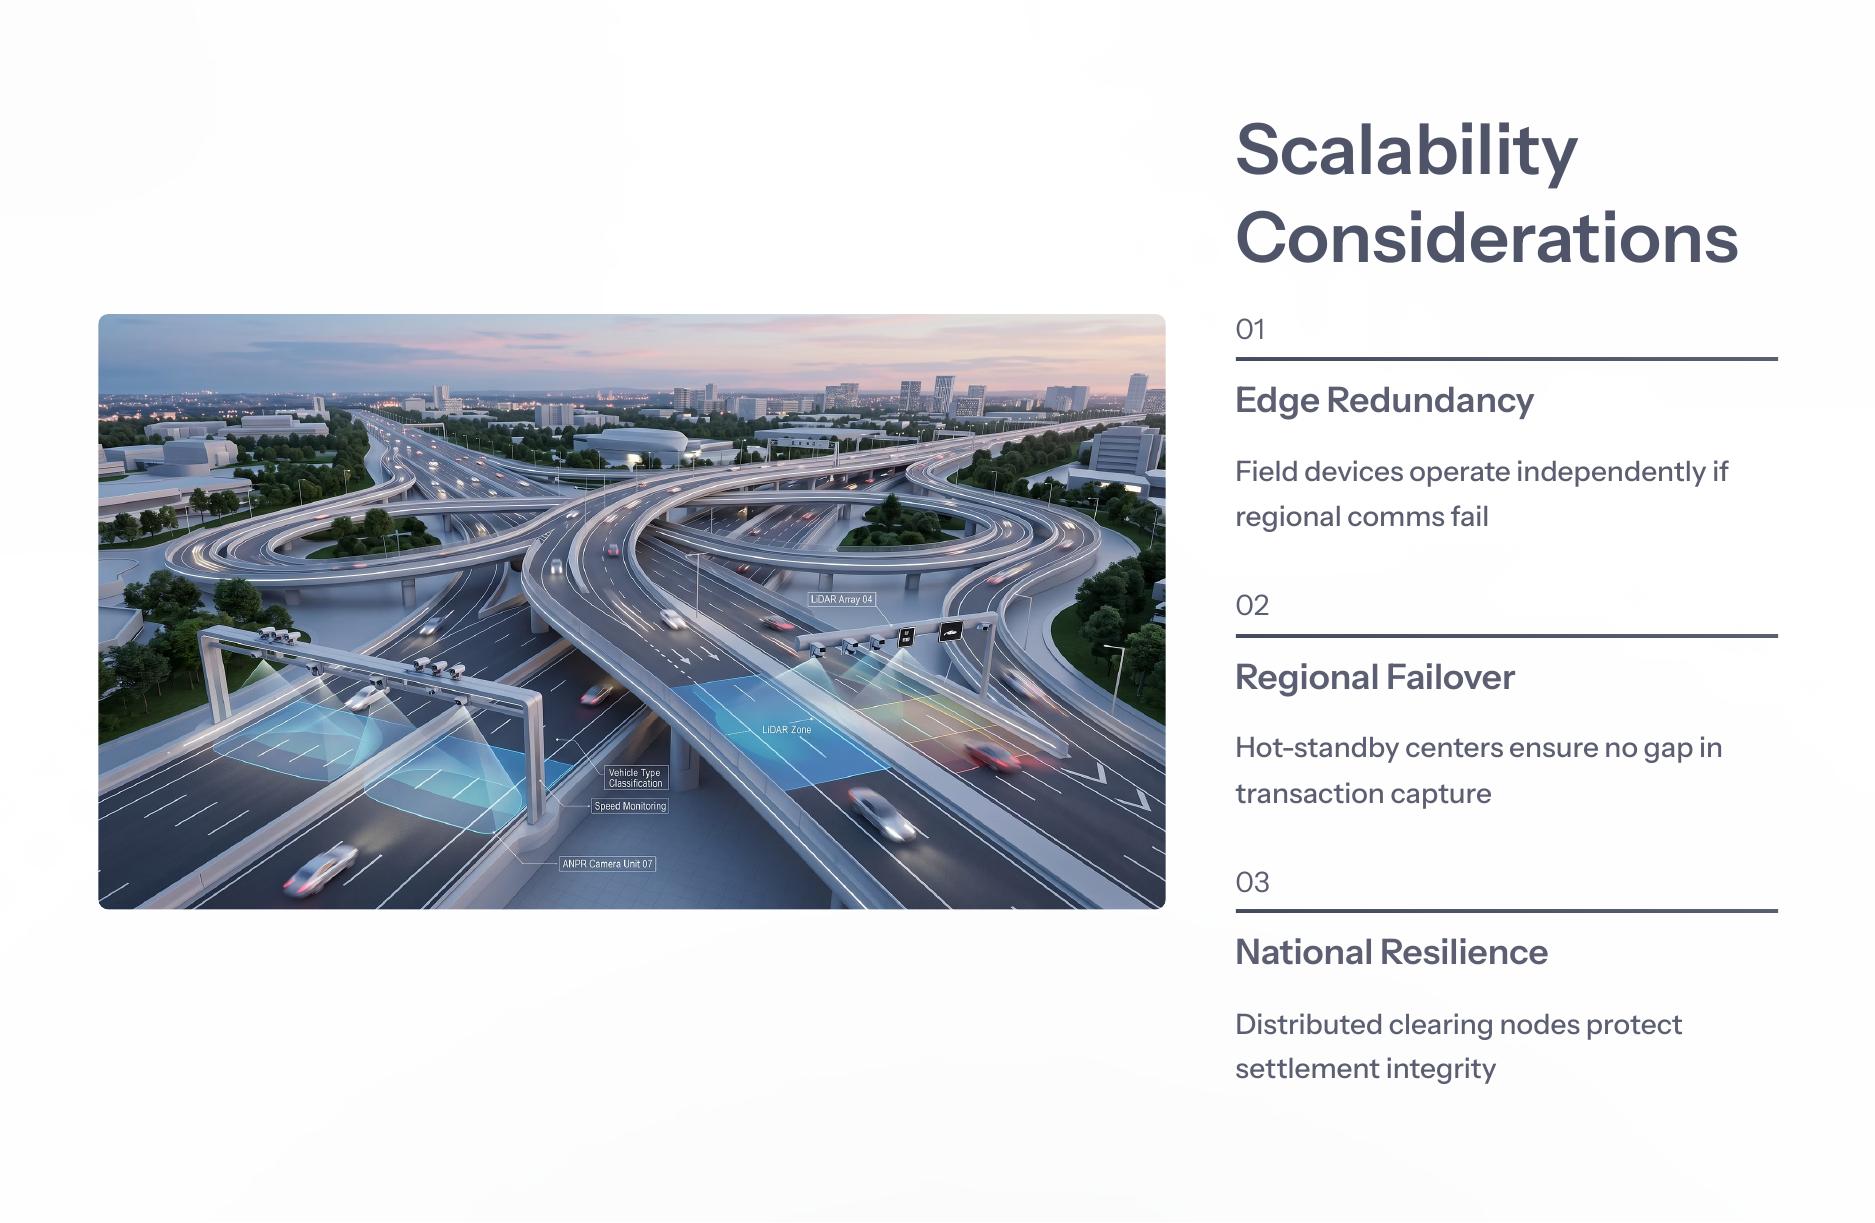
Edge redundancy, regional failover and national resilience.
Open page →The diagrams above are webpage-ready selections. The full decks remain available for technical review.